Results: Iraq
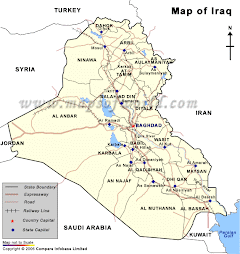
These are the latest province-by-province results from
First, these are preliminary results. The number in the % column represents the percentage of ballots which have been counted in that province.
Second, some Iraqi provinces had dozens of political parties and coalitions on the ballot; the numbers below represent only the major parties. The excluded parties (Ahrar, for example, or the Communist Party) generally received, at most, several hundred votes per province, so they're unlikely to significantly skew the outcome.
Province % Kurdish Islamic Islamic Kurdish Society Anbar 94% 6,156 4,805 274,018 40,996 n/a n/a n/a n/a 50,844 Babil 96% 219,009 170,206 98,905 15,846 1,167 n/a n/a n/a 8,520 95% 827,966 509,137 770,938 29,568 19,732 1,817 946 n/a 48,763 97% 412,635 226,836 71,552 9,253 n/a n/a n/a n/a 16,511 Dahuk 96% n/a 179 n/a n/a 315,543 22,590 57,609 3,075 n/a Dhi Qar 97% 225,971 236,303 41,732 19,710 334 n/a n/a n/a n/a Diyala 95% 59,642 80,401 228,440 6,427 43,757 7,976 2,107 n/a 23,463 95% n/a 404 n/a n/a 434,909 97,179 48,224 59,147 n/a 97% 171,844 78,543 34,980 10,852 n/a n/a n/a n/a n/a 90% 11,862 12,517 182,896 n/a 179,982 30,528 21,772 6,363 15,037 Maysan 98% 99,647 131,614 15,913 5,202 n/a n/a n/a n/a n/a Muthanna 98% 95,234 69,932 17,712 21,356 1,432 n/a n/a n/a 666 Najaf 98% 171,923 147,077 29,652 7,432 524 n/a n/a n/a n/a Ninewa 94% 15,755 32,973 546,086 48,951 207,993 9,134 4,673 1,237 57,941 Qadisiyah 97% 126,578 128,449 52,627 12,362 805 n/a n/a n/a n/a Salaheddin 95% 31,026 21,260 216,559 48,695 21,776 2,415 n/a n/a 54,988 Sulaymaniyah 93% n/a 188 n/a n/a 324,806 272,232 95,411 73,968 n/a Wassit 99% 144,794 125,588 49,378 18,576 907 n/a n/a n/a n/a Totals 2,620,042 1,976,412 2,631,388 295,226 1,553,667 443,871 230,742 143,790 276,733
Link: http://www.themajlis.org/projects/iraq-results


No comments:
Post a Comment